📊 Receipt Analytics
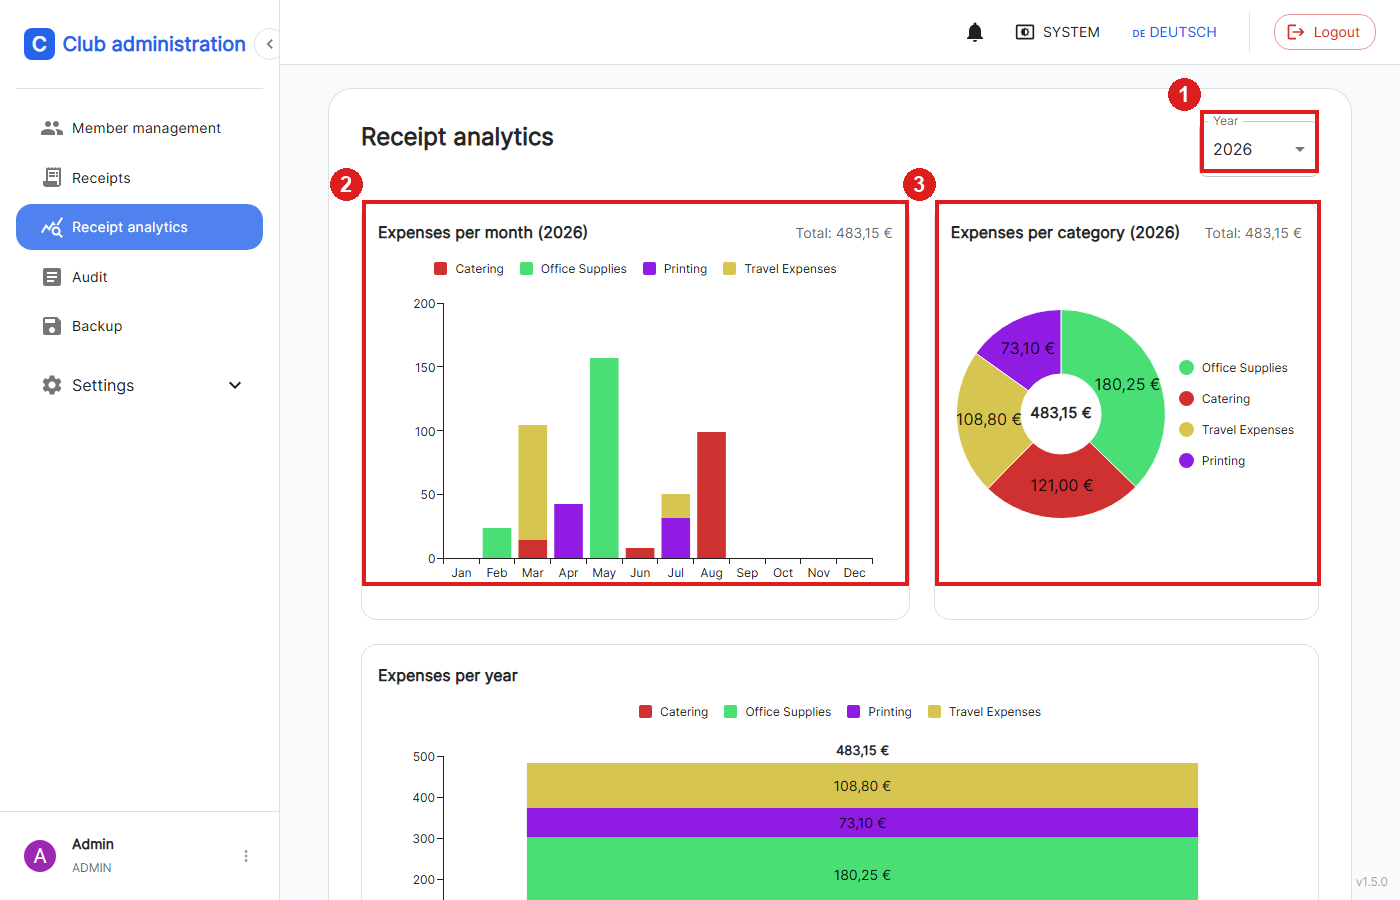
Only visible to Admin and Finance Manager.
1: Selects the year the monthly and category breakdown refers to.
2: Bar chart of expenses per month, stacked by category.
3: Pie chart of expenses per category for the selected year, with the yearly total in the center.
Below that, a further overview compares total expenses per year, also broken down by category.