📊 Financial Analysis
📈 Overview
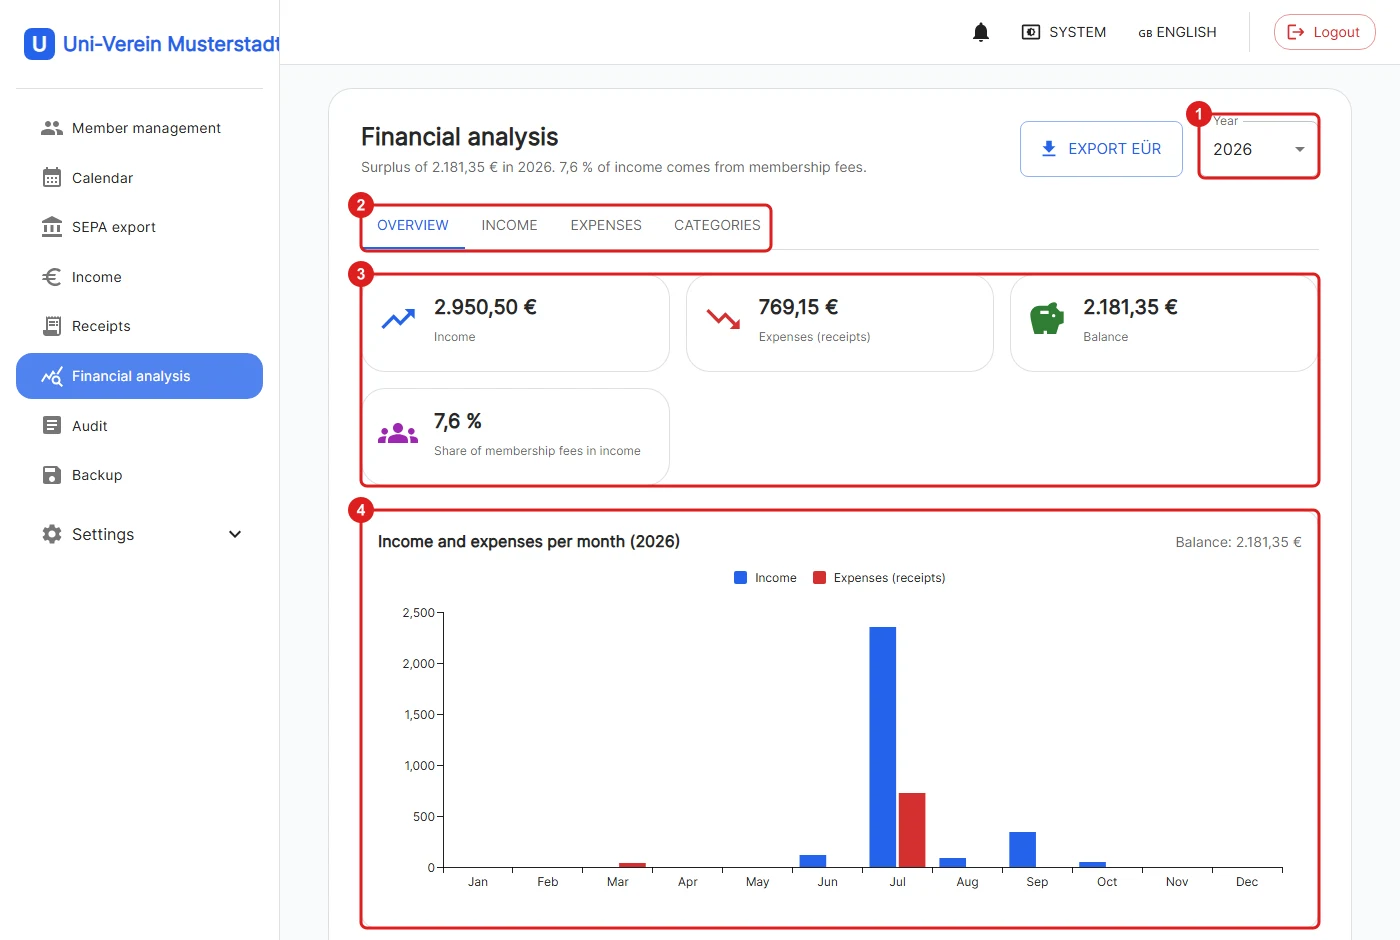
The financial analysis replaces the former receipt analytics. It compares income with the expenses from receipts and is only visible to Admins and Finance Managers.
1: Selects the year the analysis refers to. Next to it is the button for the EÜR export.
2: The tabs "Overview", "Income", "Expenses" and "Categories". The "Income" tab shows income per month and per category, "Expenses" does the same for receipts.
3: The key figures: income, expenses (receipts), the balance and the share of membership fees in the income. The sentence below the title sums it up, e.g. as a surplus or deficit for the year.
4: The bar chart compares income and expenses per month. Below it follows the comparison per year.
The "Categories" tab lists all categories with type (income or expense), total, share and the monthly average. The search filters by category name.
How is it counted?
Only paid entries count, each in the month of its payment date. This way the balance matches the EÜR.
❗️Open receipts no longer appear in the expenses until they are paid. The same applies to open income and fees. Income without a category is listed under "No category".